Published: Last Updated:
Readtime: 7 min
Every product is carefully selected by our editors and experts. If you buy from a link, we may earn a commission. Learn more. For more information on how we test products, click here.
The average Australian salary is $1,975.80 per week or $102,741.60 annually, according to the latest data from the Australian Bureau of Statistics (November 2024). This represents an increase of 4.6% annually. However, before you benchmark yourself against this skewed average, you’re better off looking at the median salary, as that gives you a clearer picture of what the average Australian earns every year.
The median weekly earnings are much lower than the average at $1,396 per week for all employees ($72,592 annually). This is broken down into $1,577 for males ($82,004 annually) and $1,200 for females ($62,400 annually), according to the ABS (August 2024).
The difference between the average and median salary is due to a skewed distribution with a long tail, or in simple terms, a small number of high-paid employees skew the average Australian salary higher.
Average Salary Data at a Glance
- Average salary in Australia: $1,975.80 per week ($102,741.60 annually)
- Males: $2,167.70 ($112,720.40 annually)
- Females: $1,850.80 ($96,241.60 annually)
- Median salary in Australia: $1,300 per week ($67,600 annually)
- Males: $1,577 ($82,004 annually)
- Females: $1,200 ($62,400 annually)
- Highest paying Industry: Mining at $2,593 ($134,836 annually) in median weekly earnings
- Highest earning state: ACT at $1,688 ($87,776 annually) in median weekly earnings
Industry-wise, mining remains the sector with the highest pay, with a median weekly income of $2,593 per week. Meanwhile, the public sector remains the most lucrative, with a full-time adult earning an average of $2,197.90 per week ($114,290.80 annually). Still, if you want to compare how you stack up with your peers, we’ve broken down the average Australian salary by age, industry, and state in detail below.

Median Full-Time Australian Salary by Age
Full-time workers’ median salary in Australia by age:
- 15-19: $800 per week ($41,600 annually)
- 20-24 years old: $1,190.30 per week ($61,895.60 annually)
- 25-34 years old: $1,538.00 per week ($79,976 annually)
- 35-44 years old: $1,821.00 per week ($94,692 annually)
- 45-54 years and older: $1,800.00 per week ($93,600 annually)
- 55-59 years and older: $1,750.00 per week ($91,000 annually)
- 60-64 years and older: $1,567.80 per week ($81,525 annually)
- 65 years and older: $1,536.60 per week ($79,903.20 annually)
Part-time workers’ median salary in Australia by age:
- 15-19: $200 per week ($10,400 annually)
- 20-24 years old: $594.50 per week ($30,914 annually)
- 25-34 years old: $750 per week ($39,000 annually)
- 35-44 years old: $850 per week ($44,200 annually)
- 45-54 years and older: $849.70 per week ($44,184.40 annually)
- 55-59 years and older: $800 per week ($41,600 annually)
- 60-64 years and older: $800 per week ($41,600 annually)
- 65 years and older: $600 per week ($31,200 annually)
Age has a significant impact on salaries in Australia. For example, people in casual employment receive a wage according to their age – the younger they are, the lower the wage. According to the ABS, between 35 and 44 years old is when you are earning the most, with a median weekly salary of $1,821.00 per week ($94,692 annually) for a full-time worker.
Young people suffer when it comes to wages, which can be attributed to job types, as young people often rely on casual work while studying. The youngest age bracket provided by the ABS suggests full-time workers are 15-19 years old, $800 per week ($41,600 annually), while part-time workers earn $200 per week ($10,400 annually).
However, a leading research analyst at the University of Sydney, Damien Oliver, suggests that discrimination may also be at play. “There is plenty of evidence to show that the labour market is strong and sophisticated enough to promote employment opportunities for young people without resorting to discrimination,” he writes.
This information supports the growing theme of an increasingly hostile environment for many young millennials in the Australian workforce. The average salary for persons under 20 is the lowest, which is about 7 per cent of Australia’s labour force. Additionally, the average wage earned by people aged 20-24 years old is significantly higher at $1,190.30 per week ($61,895.60 annually) but still nowhere near the higher age brackets.

Median Australian Salary by Industry
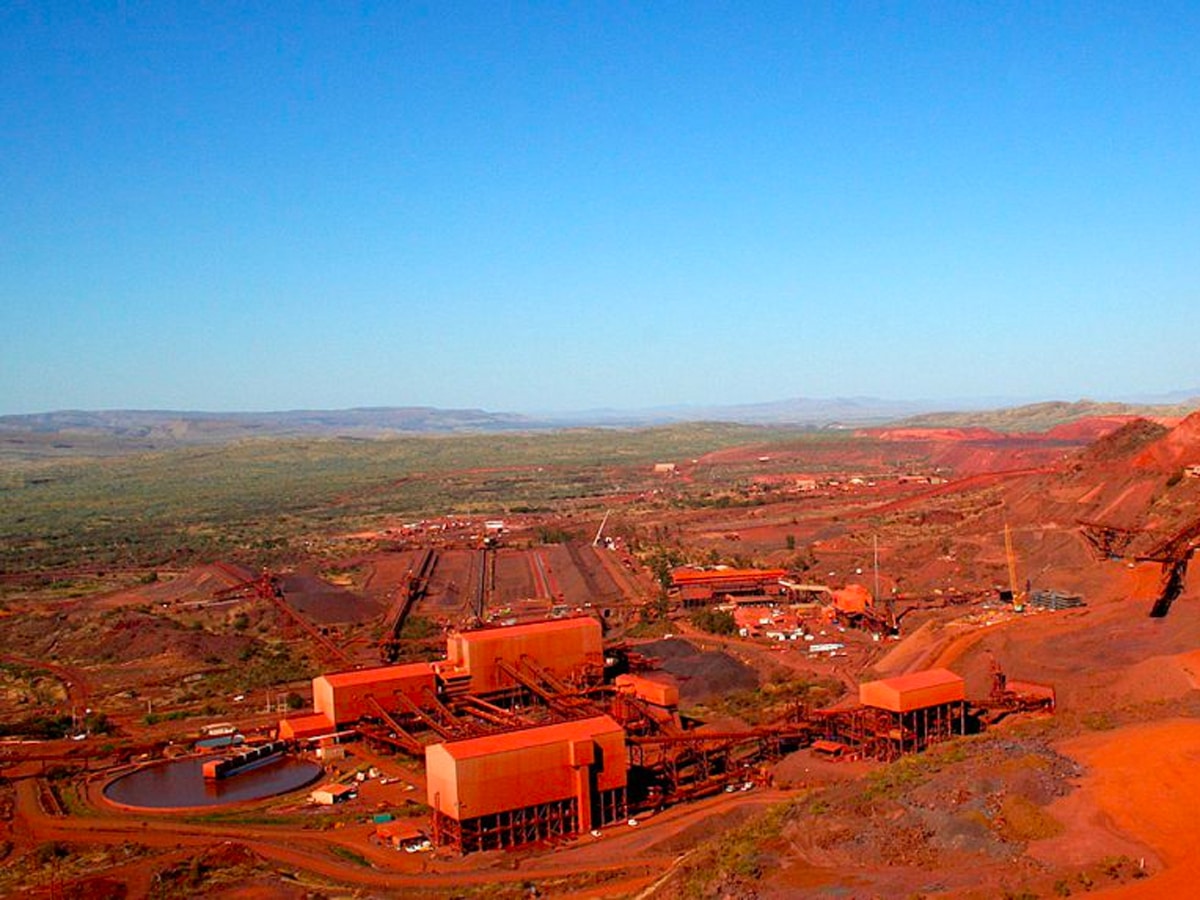
The mining industry remains the most lucrative, with a median weekly salary of $2,593 or $134,836 annually. On the other hand, the accommodation and food services industry has the lowest average salary, with average weekly earnings of $650 or $33,800 per year.
Different industries have different wage brackets, and depending on what industry you go into, the table below will give you a better idea of wage opportunities.
| Industry | Median weekly earnings | Annual earnings |
|---|---|---|
| Mining | $2,593 | $134,836 |
| Electricity, gas, water & waste services | $1,895 | $98,540 |
| Financial and insurance services | $1,750 | $91,000 |
| Public administration and safety | $1,750 | $91,000 |
| Information Media and telecommunications | $1,615 | $83,980 |
| Wholesale trade | $1,518 | $78,936 |
| Construction | $1,500 | $78,000 |
| Transport, postal and warehousing | $1,500 | $78,000 |
| Education and training | $1,500 | $78,000 |
| Manufacturing | $1,400 | $72,800 |
| Rental, hiring and real estate services | $1,400 | $72,800 |
| Administrative and support services | $1,263 | $65,676 |
| Health care and social assistance | $1,240 | $64,480 |
| Agriculture, forestry and fishing | $1,200 | $62,400 |
| Other services | $1,200 | $62,400 |
| Arts and recreation services | $1,000 | $52,000 |
| Retail trade | $893 | $46,436 |
| Accommodation and food services | $650 | $33,800 |

Average Australian Salary by State
While mining is the highest-earning industry in Australia on both average and median weekly income scales, that hasn’t helped Western Australia retain its position at the top of the states. The politicians have had their revenge, and the ACT is now the state with the highest earnings in Australia. The average worker in the ACT has an average salary of $2,178.40 per week or $113,276.80 annually, besting WA workers who rake in $2,156.80 per week or $112,153.60 annually. Comparatively, Tasmanians are barely scraping by with an average weekly salary of $1,765.60 or $91,811.20 annually.
| Region | Persons | Males | Females |
|---|---|---|---|
| NSW | $1,985.60 | $2,080.40 | $1,842.00 |
| Victoria | $1,927.90 | $2,015.00 | $1,794.80 |
| Qld | $1,953.70 | $2,039.60 | $1,819.30 |
| SA | $1,857.40 | $1,930.30 | $1,736.20 |
| WA | $2,156.80 | $2,330.10 | $1,860.30 |
| Tasmania | $1,765.60 | $1,799.70 | $1,705.00 |
| NT | $1,886.60 | $2,000.00 | $1,771.80 |
| ACT | $2,178.40 | $2,250.70 | $2,096.20 |
| Australia | $1,975.80 | $2,072.70 | $1,826.40 |

How Large is the Gender Pay Gap in Australia?
In Australia, full-time working men earn more than full-time working women, and the gender pay gap currently stands at 10.2% for ordinary-time cash earnings and 13% for total cash earnings. This is represented in the following amounts:
- Median weekly cash earnings for men – $1,786 per week (full-time worker)
- Median weekly cash earnings for females – $1,600 per week (full-time worker)
Gender has a strong impact on the median income of Australians. The weekly income for males is still $377 higher than for females when comparing full-time workers (according to data provided by the ABS).
This pay gap is evident in the overwhelming majority of industries, including modelling and sex work, with the gender pay gap nearing $1b per week, according to figures reported by news.com.au. Workplace Gender Equality Agency (WGEA) director Libby Lyons said even before the COVID-19 pandemic hit, Australian employers had become “complacent” about gender equality. One shocking reality is that gender pay gaps are often influenced by discrimination and bias.
The pay gap is also influenced by women and men working in different industries and jobs, with women dominating part-time and casual work. Also, women take up a huge share of unpaid caring and domestic work and spend more time out of the workforce, which impacts their ability to work in senior roles.

Average Australian Salary Over Time
With the average salary in Australia sitting at $2,025.90 per week, the average annual wage has skyrocketed beyond $105,346.80 annually (pre-tax). However, the year-on-year increases highlight an issue with wage growth. Aussie full-time workers may be earning 4.6 per cent more than they were last year, but the rate is barely ahead of Australia’s inflation rate, which is in a recovery stage and sitting around 2.4%, according to the Consumer Price Index.
| Persons | Males ($) | Females ($) | |
|---|---|---|---|
| May 2012 | $1,401.50 | $1,493.60 | $1,245.50 |
| November 2012 | $1,441.00 | $1,533.00 | $1,281.80 |
| May 2013 | $1,464.40 | $1,555.70 | $1,301.60 |
| November 2013 | $1483.50 | $1,574.90 | $1,323.40 |
| May 2014 | $1,502.50 | $1,604.70 | $1,329.90 |
| November 2014 | $1,528.40 | $1,634.50 | $1,351.70 |
| May 2015 | $1,537.30 | $1,641.60 | $1,368.50 |
| November 2015 | $1,556.50 | $1,654.70 | $1,392.00 |
| May 2016 | $1,568.30 | $1,661.70 | $1,411.30 |
| November 2016 | $1,584.30 | $1,677.40 | $1,430.20 |
| May 2017 | $1,594.10 | $1,683.60 | $1,444.90 |
| November 2017 | $1,615.30 | $1,704.60 | $1,466.60 |
| May 2018 | $1,631.10 | $1,717.40 | $1,488.20 |
| November 2018 | $1,651.30 | $1,735.80 | $1,512.90 |
| May 2019 | $1,681.60 | $1,768.00 | $1,542.60 |
| November 2019 | $1,706.20 | $1,791.40 | $1,567.90 |
| May 2020 | $1,762.20 | $1,853.10 | $1,618.00 |
| November 2020 | $1,757.20 | $1,842.50 | $1,619.40 |
| May 2021 | $1,783.70 | $1,876.60 | $1,633.20 |
| November 2021 | $1,794.60 | $1,885.60 | $1,648.70 |
| May 2022 | $1,816.10 | $1,912.50 | $1,665.80 |
| November 2022 | $1,851.30 | $1,944.40 | $1,707.00 |
| May 2023 | $1,883.10 | $1,976.80 | $1,740.90 |
| November 2023 | $1,934.80 | $2,021.10 | $1,802.80 |
| May 2024 | $1,972.60 | $2,054.80 | $1,845.40 |
| November 2024 | $2,025.90 | $2,114.50 | $1,889.20 |

Weekly Australian Tax Table
The Australian government offers a weekly tax table tool, which helps work out salaries, taxes, and everything in between. To use this table, you need to work out the withholding amount. Start by calculating your employee’s total weekly earnings and add any allowances and irregular payments that are to be included in this week’s pay to the normal weekly earnings, ignoring cents. Use the appropriate column to find the correct amount to withhold. If your employee is claiming the tax-free threshold, use column 2 or column 3 if not.
The next few steps are shown to you in the tool, which you can find here.


Comments
We love hearing from you. or to leave a comment.