

Updated:
Readtime: 8 min
Every product is carefully selected by our editors and experts. If you buy from a link, we may earn a commission. Learn more. For more information on how we test products, click here.
- June vehicle sales hit a record 140,058 units across Australia.
- BYD trailed Toyota’s monthly national sales lead by 243 vehicles.
- Battery electric vehicles captured a 23.3 per cent market share.
- BYD achieved outright sales leadership across four states and territories.
- The company-owned cargo ship delivered 4,809 vehicles to local ports.
The historic hierarchy of the Australian automotive market is on the verge of total collapse. Toyota has enjoyed an unassailable position at the top of the local sales charts for decades, but the release of the latest VFACTS sales data has revealed an unprecedented reality. Chinese electric vehicle giant BYD has closed the monthly sales gap to just 243 vehicles nationwide, putting it within striking distance of dethroning the Japanese market leader.
This structural disruption comes amid the highest monthly sales volume ever recorded in Australian history, with total new vehicle deliveries reaching 140,058 units in June. While Toyota managed to hang on to its national crown with 19,124 monthly sales, BYD surged right behind it, securing 18,881 deliveries. The numbers track a broader, systemic decline for the incumbent leader, as Toyota’s year-to-date market share has slid from 19.9 per cent down to 15.7 per cent, while BYD’s share has more than doubled from 3.8 per cent to 8.6 per cent over the exact same period.
It’s a rapid transition that highlights a swift shift in consumer behaviour as rising cost-of-living pressures and volatile fuel prices drive buyers toward cheaper plug-in alternatives. Rather than a temporary market blip, this surge in volume represents a permanent realignment of the local industry. By analysing regional delivery data, vehicle transport logistics, and specific model outcomes, we have mapped exactly how BYD is systematically dismantling traditional strongholds across the country.
Shift in Consumer Sentiment and Fuel Pressures
This sudden realignment of power is directly tied to an acceleration in electric vehicle adoption rates. Battery electric vehicles accounted for a substantial 23.3 per cent of all sales from all sources in June, which represented a modest 7.6 per cent share of the local market in the same period last year.
Speaking on the news, Federal Chamber of Automotive Industries Chief Executive Tony Weber confirmed that the first half of 2026 has delivered a permanent transformation in local buying habits, with EV market share rising steadily every single month from 8.4 per cent in January to its current peak. It’s not too early to say that external economic variables have forced consumers to re-evaluate their long-term choices, and Weber pointed directly to global logistical complications and pricing pressures as the primary catalysts for this sudden migration.
“The Australian automotive market has shifted on its axis during the first months of 2026. This year is likely to represent a significant turning point for the Australian automotive industry,” Mr Weber said. “Global uncertainty, including conflict in the Middle East and volatility in petrol prices, appears to have sharpened consumer interest in vehicles that reduce exposure to fuel prices. While these factors have had a short-term impact, part of the EV growth would appear to be a permanent structural shift.”
Shrinking National Sales Gap
The reality of the current market is a compressed race between the top two automotive brands. While Ford, Kia, and Hyundai continue to battle for the minor positions with sub-seven per cent market shares, Toyota and BYD have effectively pulled away into a direct duel for dominance.
Toyota’s year-to-date sales volume stands at 95,141 units, representing a noticeable decline from the 120,978 vehicles it sold by this time last year.
On the flipside, BYD’s manufacturing engine has accelerated very, very quickly. The brand delivered 52,335 vehicles in the first half of 2026, well clear of the 23,355 units it achieved in the same period the prior year. The gap in June narrowed down to a rounding error, with Toyota capturing a 13.7 per cent national market share and BYD sitting immediately behind at 13.5 per cent when synthesising VFACTS and EV Council datasets.
Backdoor Regional Strategy and State Leadership
While the national summary indicates a narrow lead for Toyota, the state-by-state data confirm that BYD has already broken through and captured the majority of Australia’s key regional populations. Toyota is currently maintaining its national lead by defending its high-volume operations in New South Wales, Western Australia, and South Australia. Everywhere else, the Japanese brand has been forced into second or third place.
| State or Territory | BYD Volume | Toyota Volume | Secondary Market Leader |
| Victoria | 5,389 units (14.4%) | 4,206 units (11.3%) | Ford (6.9%) |
| Queensland | 4,313 units (13.8%) | 4,260 units (13.7%) | Ford (6.7%) |
| Tasmania | 295 units (13.7%) | 275 units (12.8%) | Ford (9.3%) |
| Australian Capital Territory | 413 units (19.0%) | 226 units (10.4%) | Tesla (15.5%) |
When we look at Victoria, BYD opened up a clear lead of more than 1,100 vehicles over Toyota, capturing 14.4 per cent of the state’s total volume.
The race was much tighter in Queensland, where BYD beat out its rival by just 53 units to claim the top spot. Finally, in the Australian Capital Territory, Toyota was outpaced, sliding down to third place behind both BYD and Tesla. The geographical distribution confirms that in metropolitan and progressive tertiary markets, consumer preferences have changed, and clawing this back will be difficult.
Material Deliveries via the BYD Zhengzhou Fleet Play
The primary mechanism that enabled BYD’s record-breaking June delivery phase was a logistics play that mirrors the brand’s global focus on vertical integration.
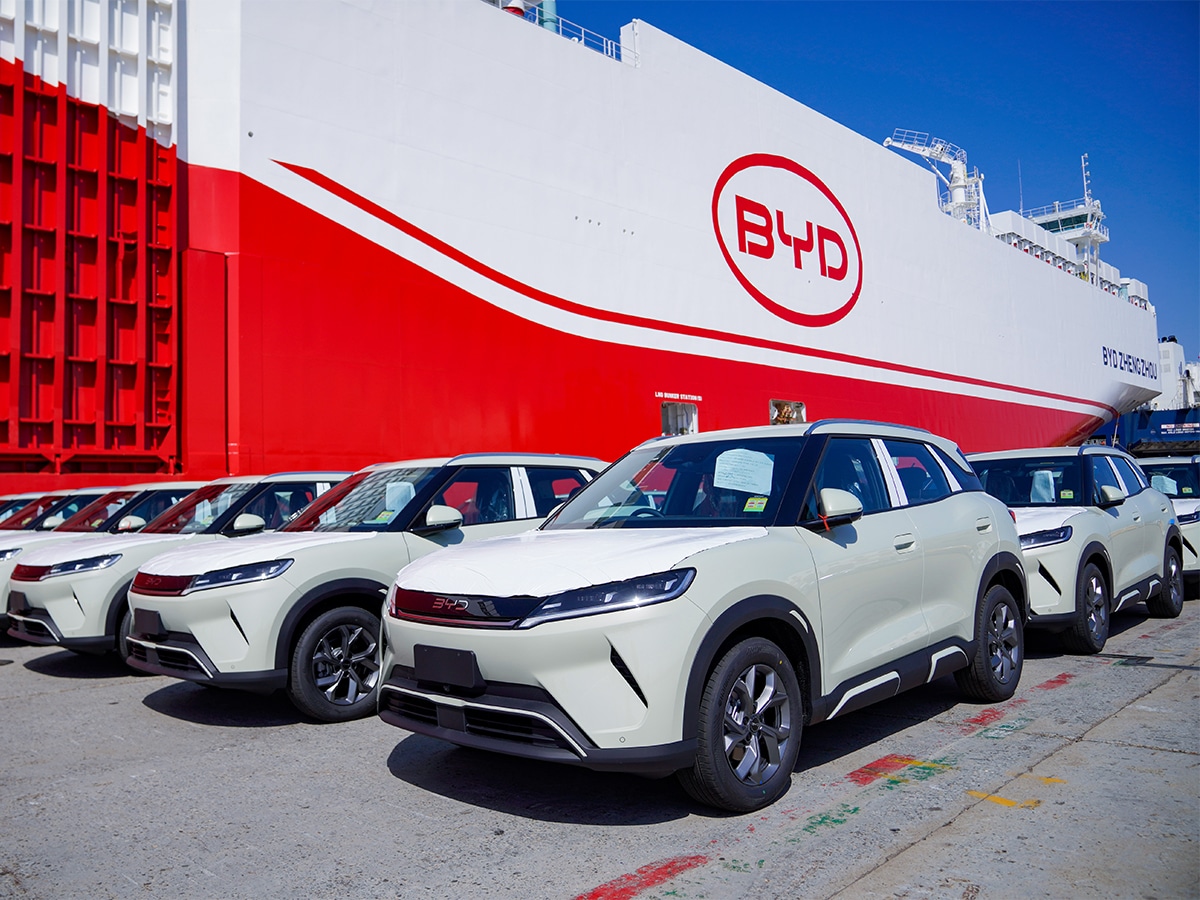
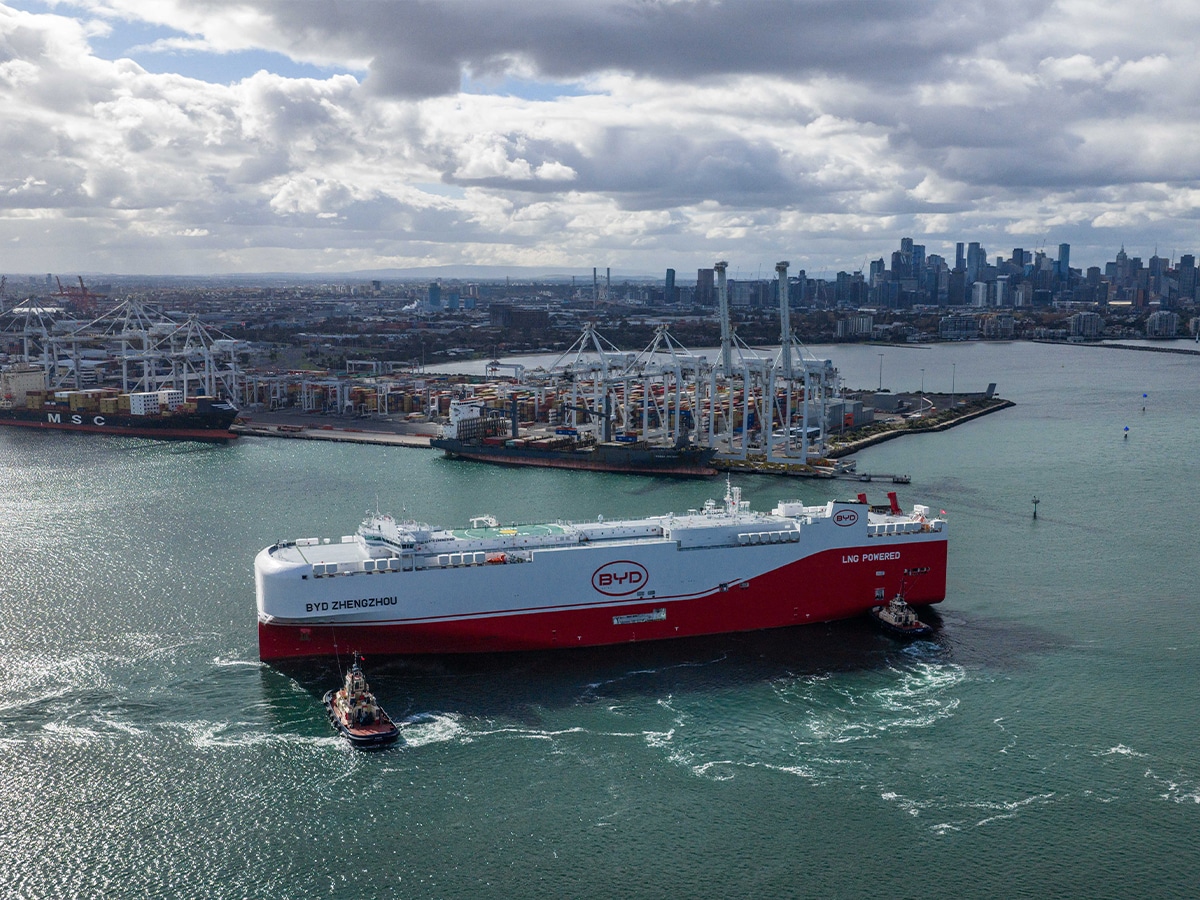
When consumer orders more than doubled due to escalating cost-of-living concerns, the local division sidestepped traditional third-party commercial shipping delays by deploying its own infrastructure. The maiden voyage of the BYD Zhengzhou (a massive, company-owned and operated car-carrying vessel) arrived at the Port of Melbourne to load thousands of vehicles directly off the ship to local dealers. Of course, there were plenty of automotive media in attendance to share the news.
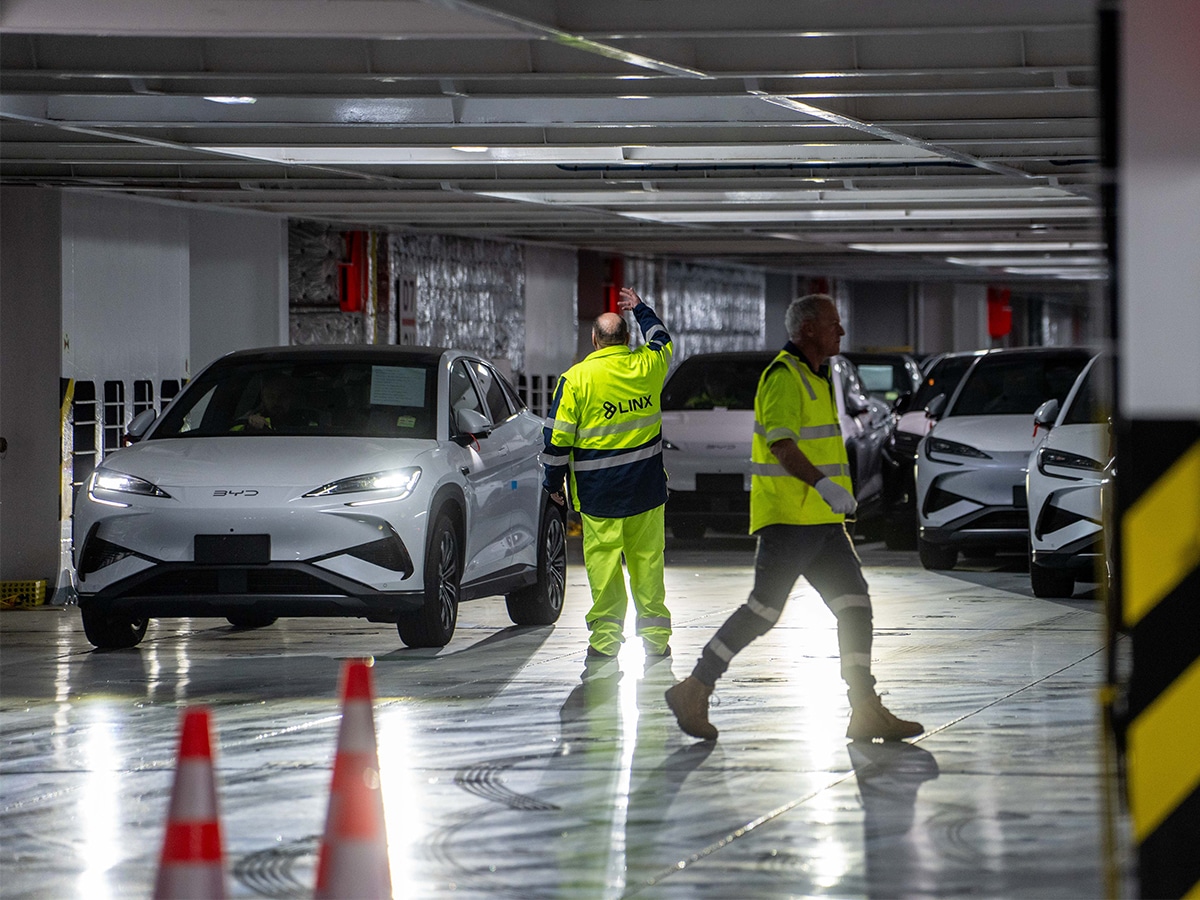
The vessel carried 4,809 new energy vehicles dedicated to clearing the backlogs of those eagerly waiting Australian customers. By the numbers, the vessel distributed 1,855 vehicles into Melbourne, before continuing north to unload 1,519 units in Sydney and a final 1,435 units in Brisbane.
BYD Australia Chief Operating Officer Stephen Collins confirmed that this direct control over international shipping routes allowed the company to execute immediate delivery turnarounds that outside manufacturers simply could not match. “We asked our customers to back us in, and they did, and we delivered,” Mr Collins said. “We thank them for having faith in us to make good on a promise we made in early April, which was to deliver vehicles in record time when orders more than doubled as cost-of-living pressures intensified with skyrocketing fuel prices.”
“The record June delivery number was the result of full factory support with increased production, including a special delivery of almost 5,000 additional BYD and DENZA vehicles on a BYD-owned vessel.”
Model Breakdowns and the Duelling Product Portfolios
The final pillar supporting BYD’s rapid market capture is the sheer breadth of its expanding model portfolio, which contrasts sharply against Toyota’s historic reliance on a few legacy nameplates.
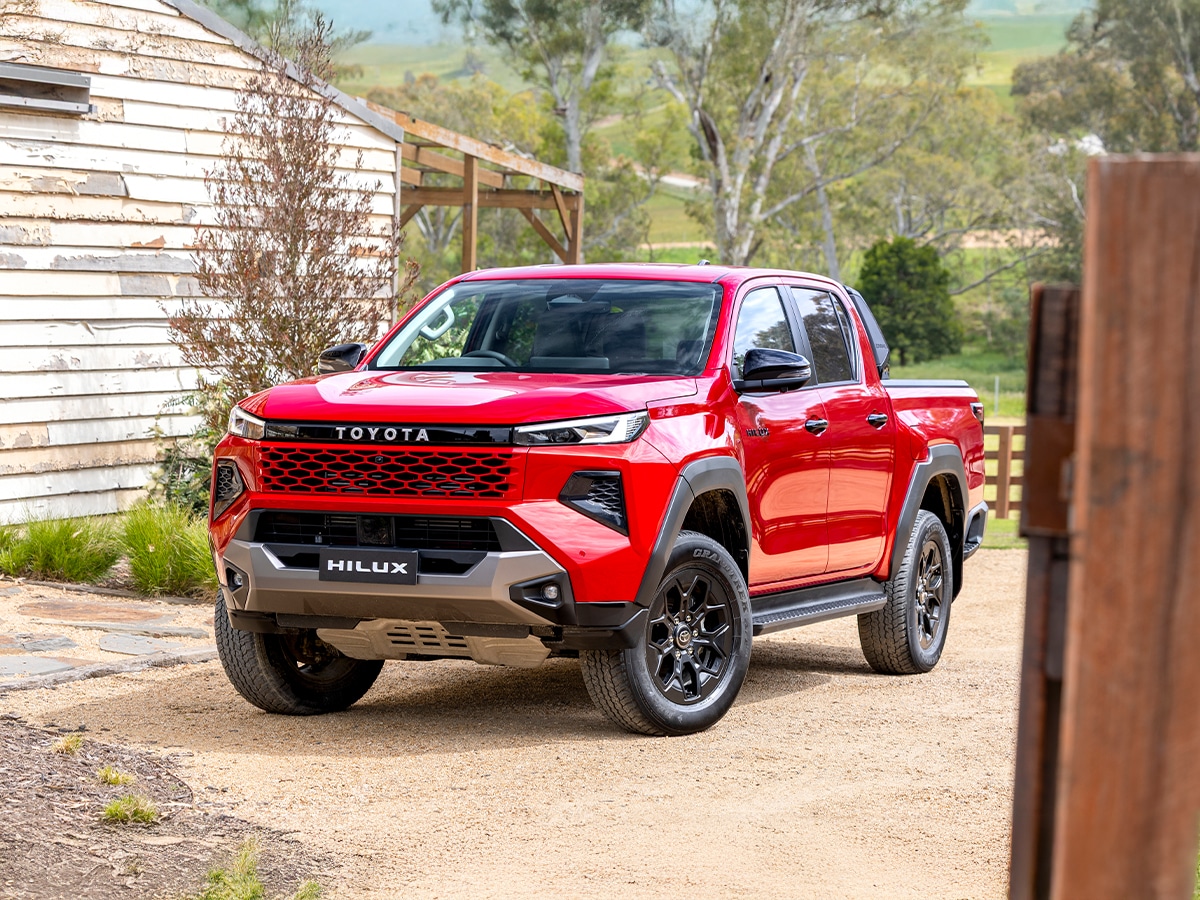
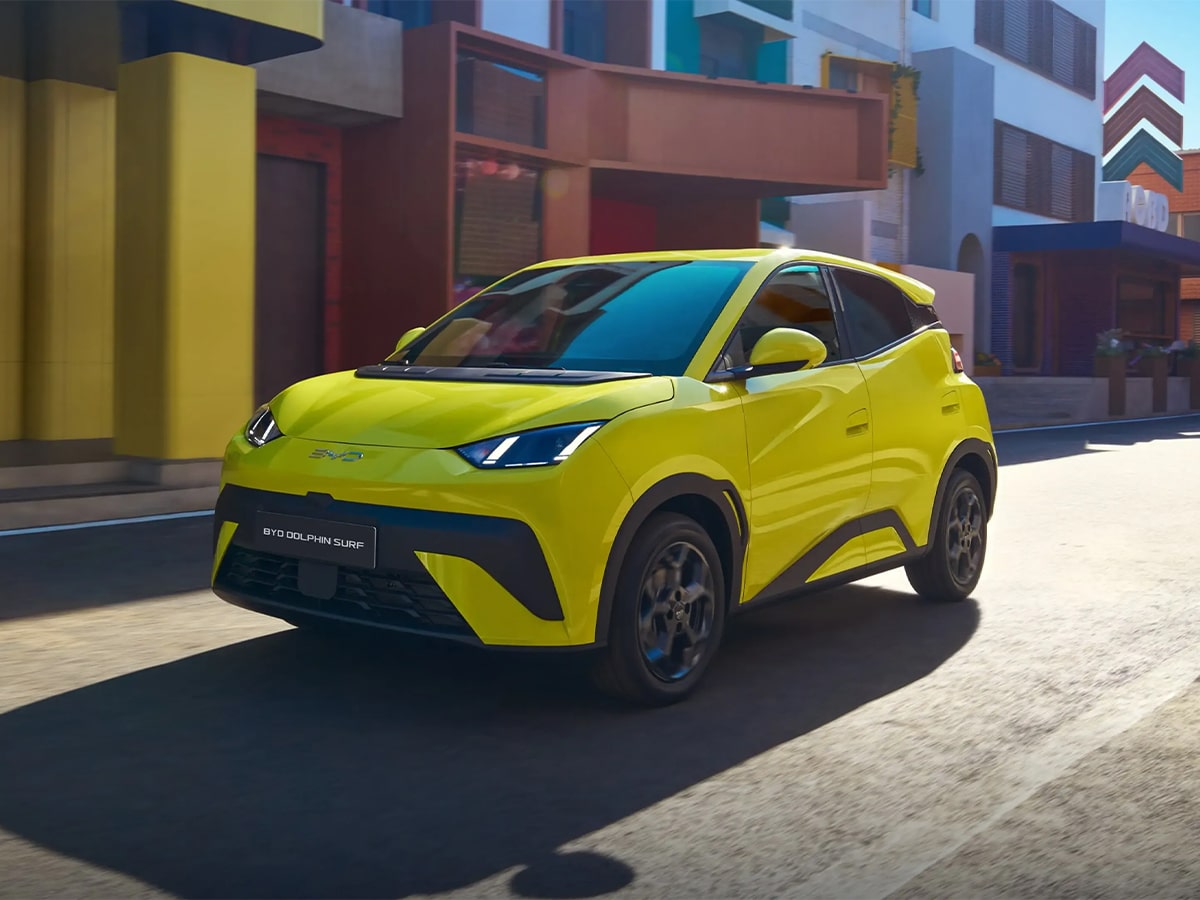
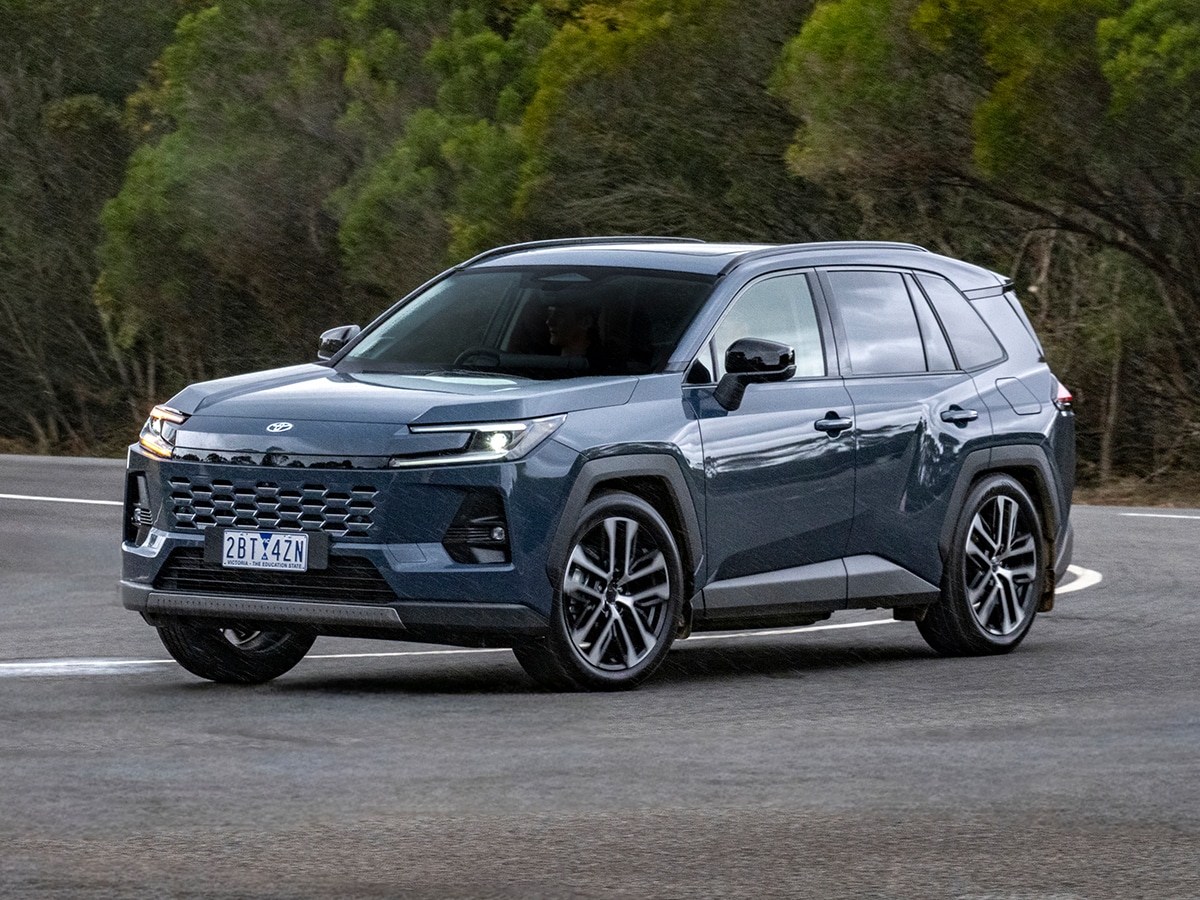
While Toyota relies heavily on the continued output of the RAV4 and the Hilux range to protect its brand equity, BYD has released eleven distinct models across multiple segments to capture separate consumer demographics simultaneously.
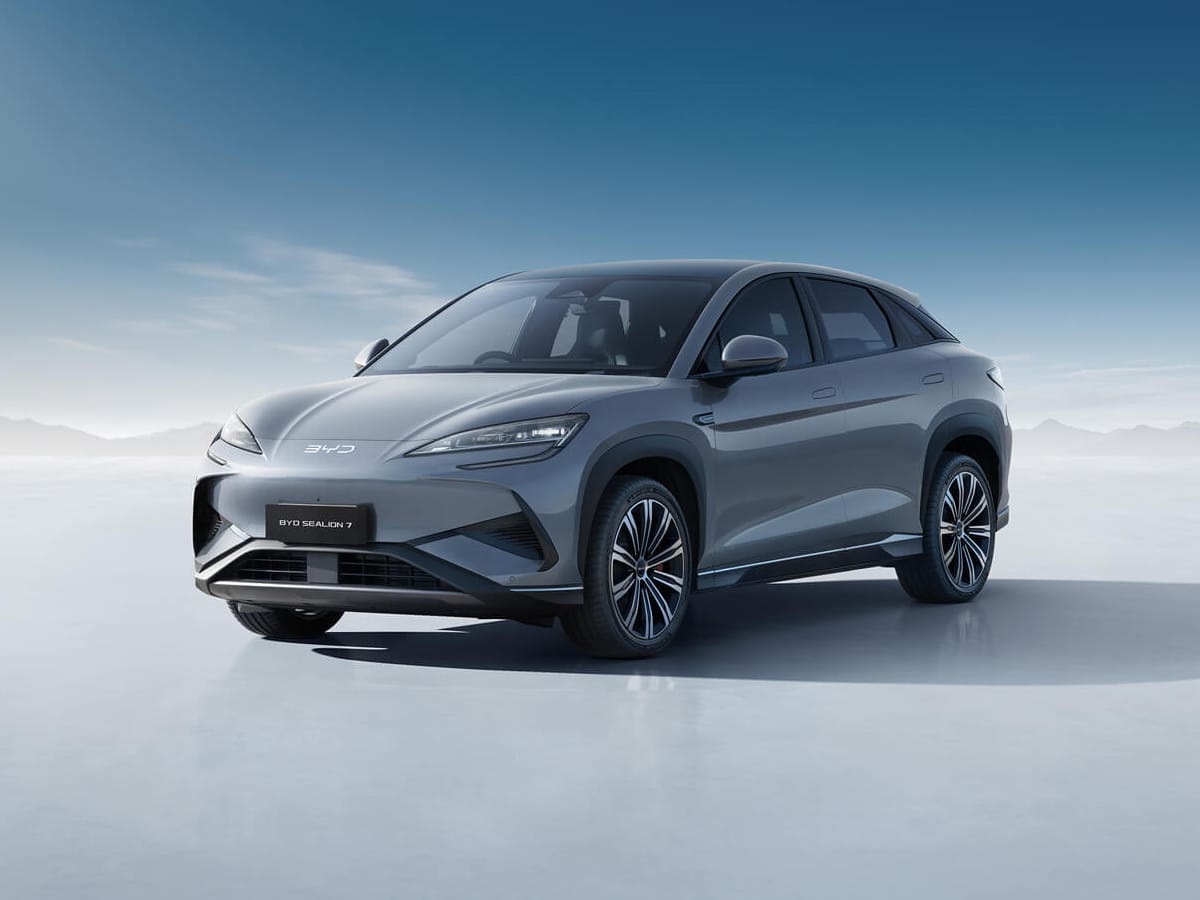
The mid-sized BYD Sealion 7 SUV served as the brand’s primary volume driver in June 2026, recording 4,730 deliveries and finishing as the third-highest-selling model in the country. Right behind it, the BYD Shark 6 ute secured 3,398 sales to land at number five on the national model rankings, placing further pressure on the second-placed Toyota Hilux 4×4, which recorded 5,175 sales. The baseline volume was further reinforced by highly consistent performances across the brand’s broader product matrix. On the cheap end, the BYD Atto 2 added 2,482 units to the monthly tally, while the Sealion 6 plug-in hybrid contributed an additional 2,218 deliveries.
What This Means for the Future of the Australian Car Market
The June VFACTS data confirms that Toyota’s historic monopoly on the local automotive market has reached its final chapter.
Japanese brands no longer compete against a fragmented field of legacy manufacturers. They’re fighting a defensive battle against a vertically integrated manufacturing machine that controls its own factories, battery technology, and shipping fleet.
With the national sales margin compressed to a mere 243 vehicles and BYD already holding clear territory leadership across four states and territories, the transition at the top of the ladder is no longer a matter of if, but when.


Comments
We love hearing from you. or to leave a comment.